01 / 12

What if your operations dashboards wrote themselves
from your database?

JM Test · AI Operations Intelligence

↓ scroll to continue

The dashboards your team needs don't exist yet.

Operations leaders at calibration labs rebuild the same dashboards over and over — in Tableau, in PowerBI, by hand. Every new role asks for a different cut. Every new question takes a week.

Technicians want their personal queue. Execs want the strategic picture. Customer success wants the compliance funnel. Different surfaces, same database, all hand-built.

The data is already there. CalMApp has 438 tables of operational truth. What's missing is the synthesis layer — and that layer has always been human.

Three tiers of AI inside CalMApp.

Each tier replaces more human work than the one before it.

TIER 1 · REPLACEMENT

The reports your team already builds — now AI-generated.

Every monthly retest backlog report, every revenue breakdown, every operational digest your ops team builds by hand today — the AI generates it automatically from CalMApp's database. Same numbers, no human in the loop. The first tier replaces existing labor.

Cost reduction → zero analyst time per report
TIER 2 · DATA-DERIVED REPORTING

Reports nobody asked for — but everyone needs.

The AI looks at your data and surfaces patterns your team didn't think to query. New report types you'd never have requested but immediately recognize the value of. The second tier creates capability you didn't have before.

New capability → patterns hidden in 438 tables
TIER 3 · INSIGHTS · FLAGSHIP

Not what happened. What to do about it.

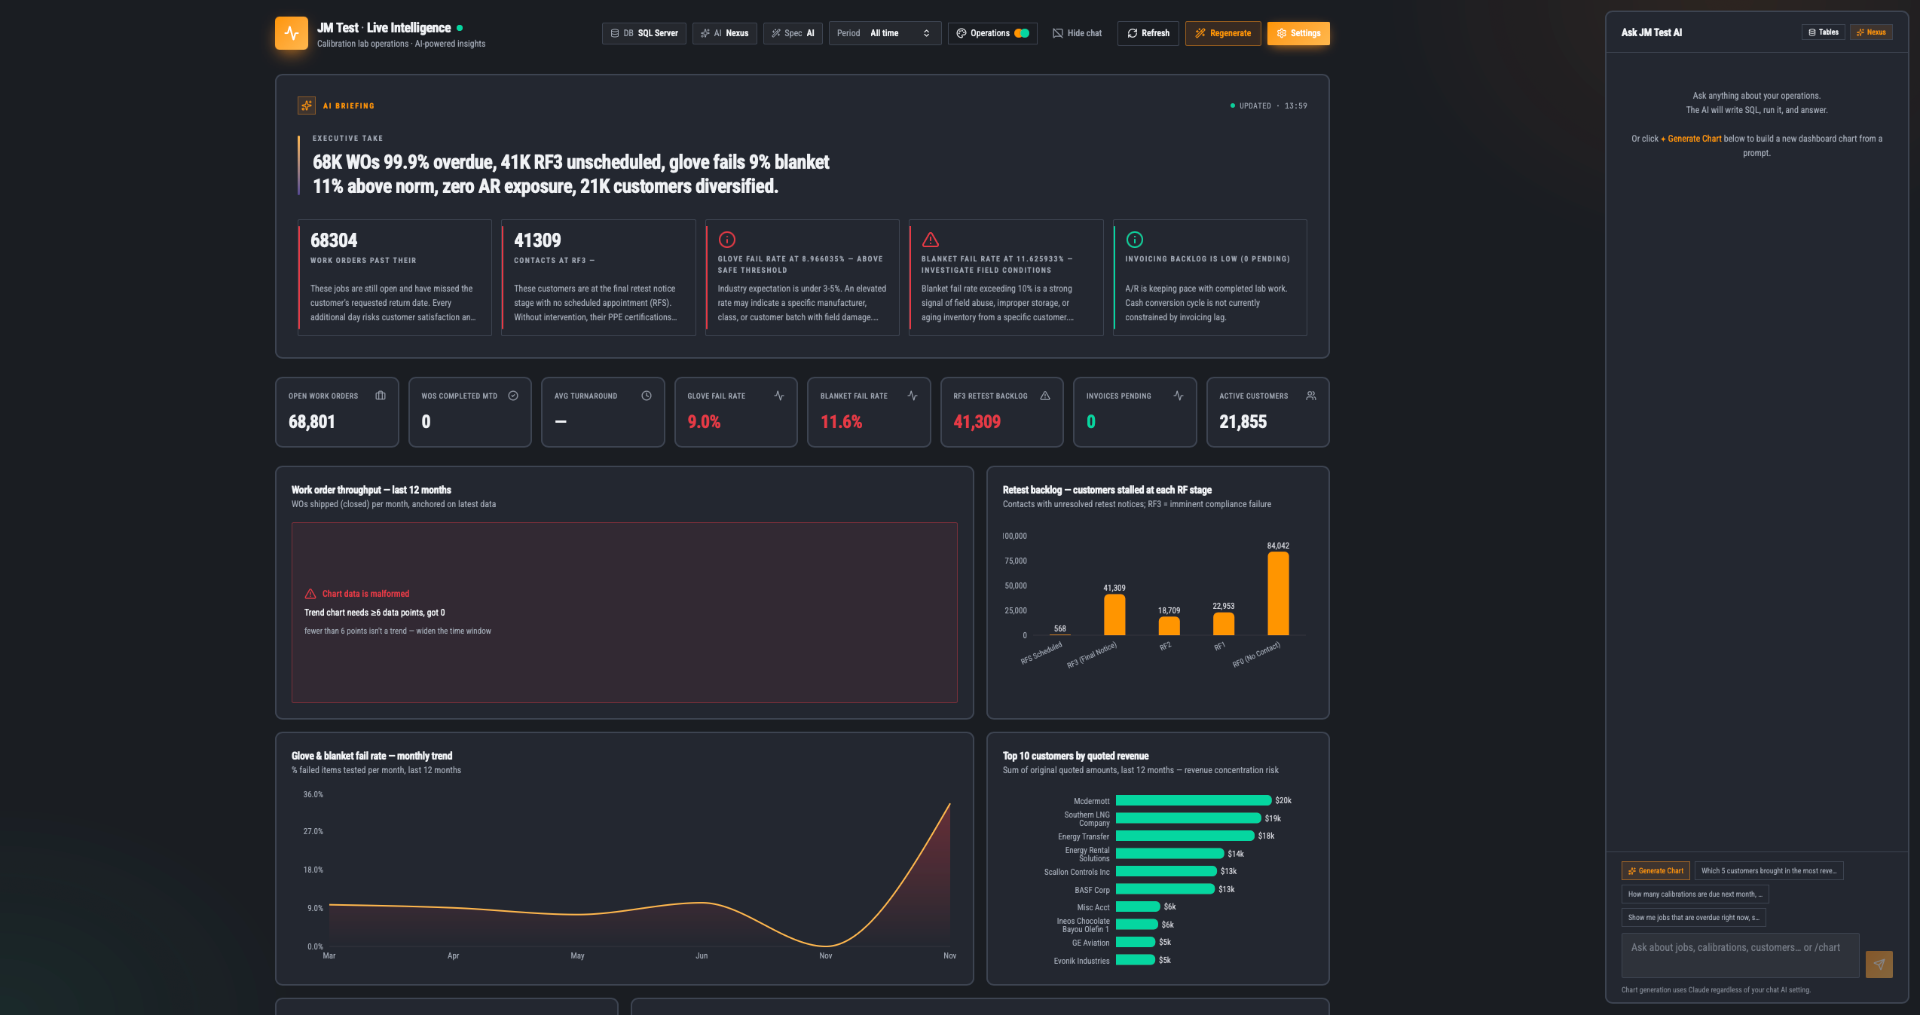
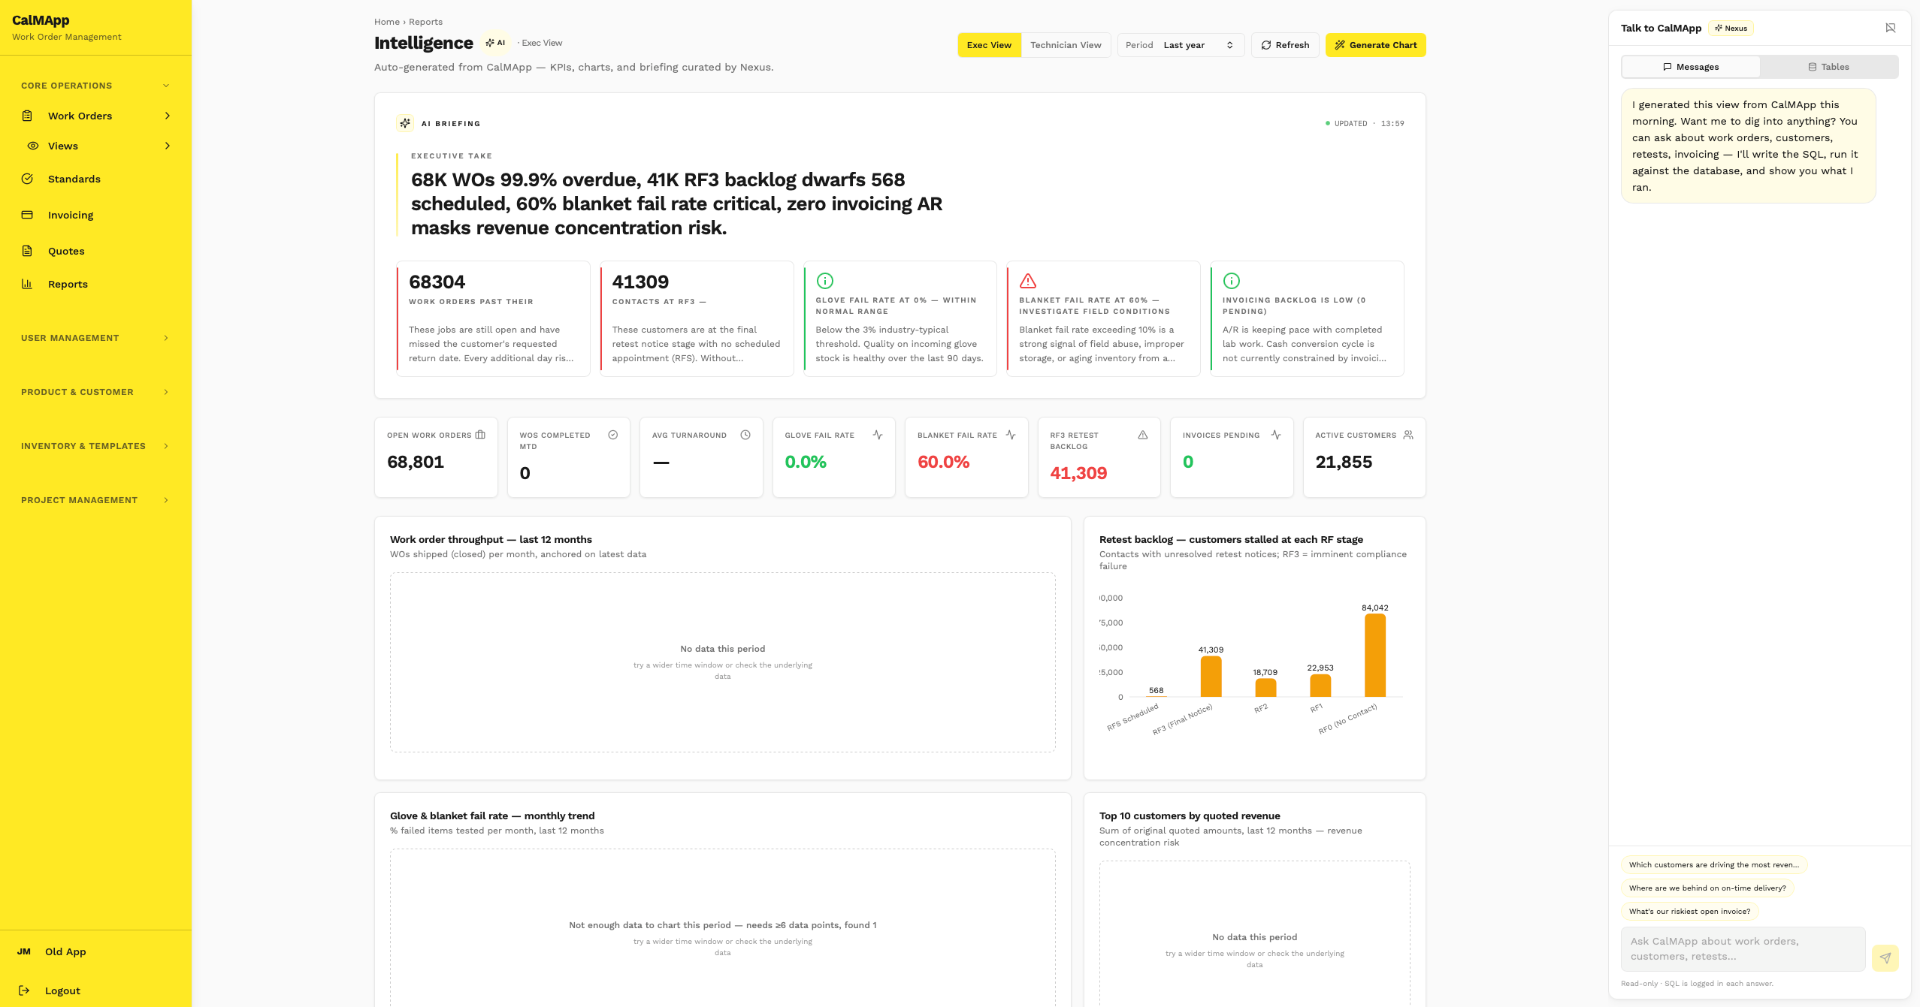
The third tier is the differentiator. The AI doesn't just report — it interprets. “Blanket fail rate is at 60%, well above the 3% industry norm. Investigate field conditions or storage. Three customer accounts hold 40% of your overdue retests; here's the order to call them in.” Action, not just data.

Business impact → tells your team what to do
AI Briefing closeup — Tier 3 insights

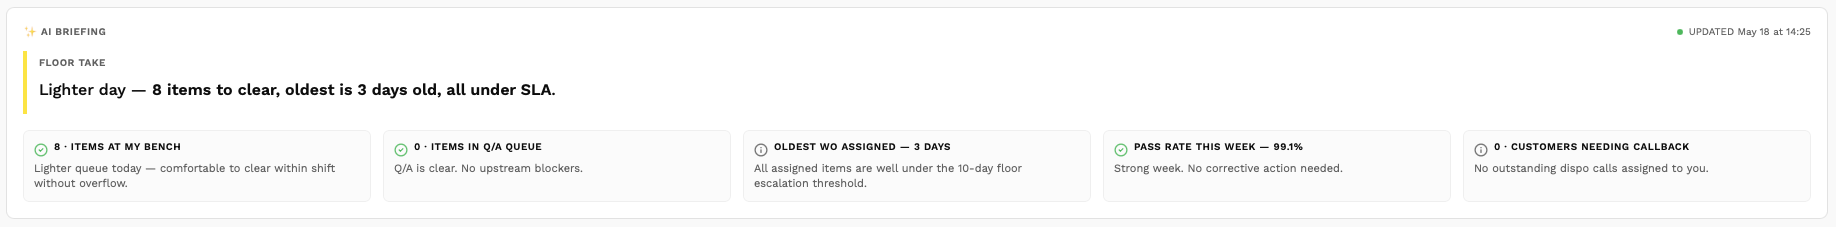
Tier 3 in the product — the AI Briefing tells the team what to do, not just what happened.Prototype · representative data

What they look like.

Deploy as a dedicated executive portal, or embed inside CalMApp. Same dashboards, same chat, same intelligence — different surface for different audiences.

Standalone executive dashboard, dark theme
Standalone executive portal
Dedicated URL · executive-tier aesthetic · for leadership who don't live in CalMApp
Dashboard embedded in CalMApp, native yellow theme
Embedded in CalMApp
Native sidebar · operational team's daily tool · technicians and managers stay in their flow

Five role-shaped views, one engine. Deploy embedded in CalMApp or as a standalone portal — same dashboards, same chat, different surface for different audiences.

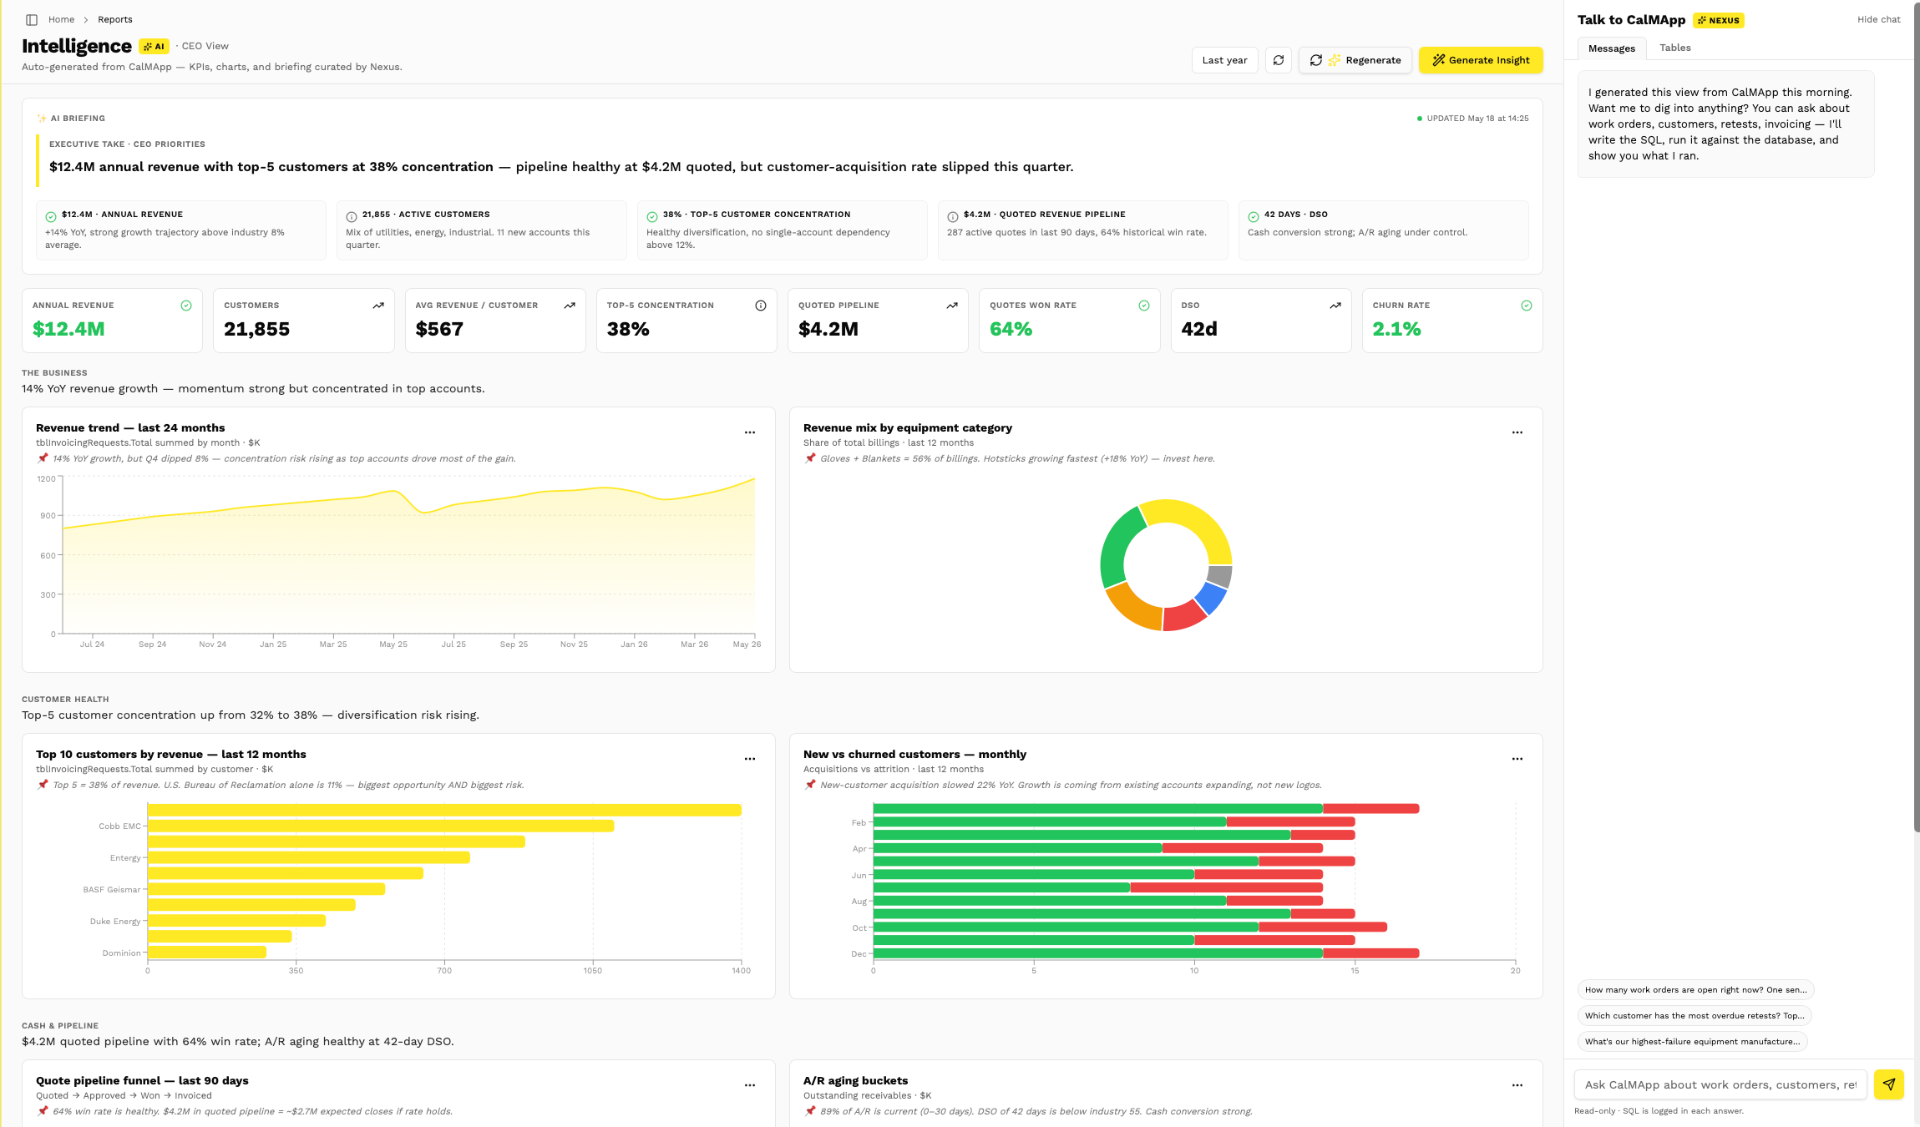
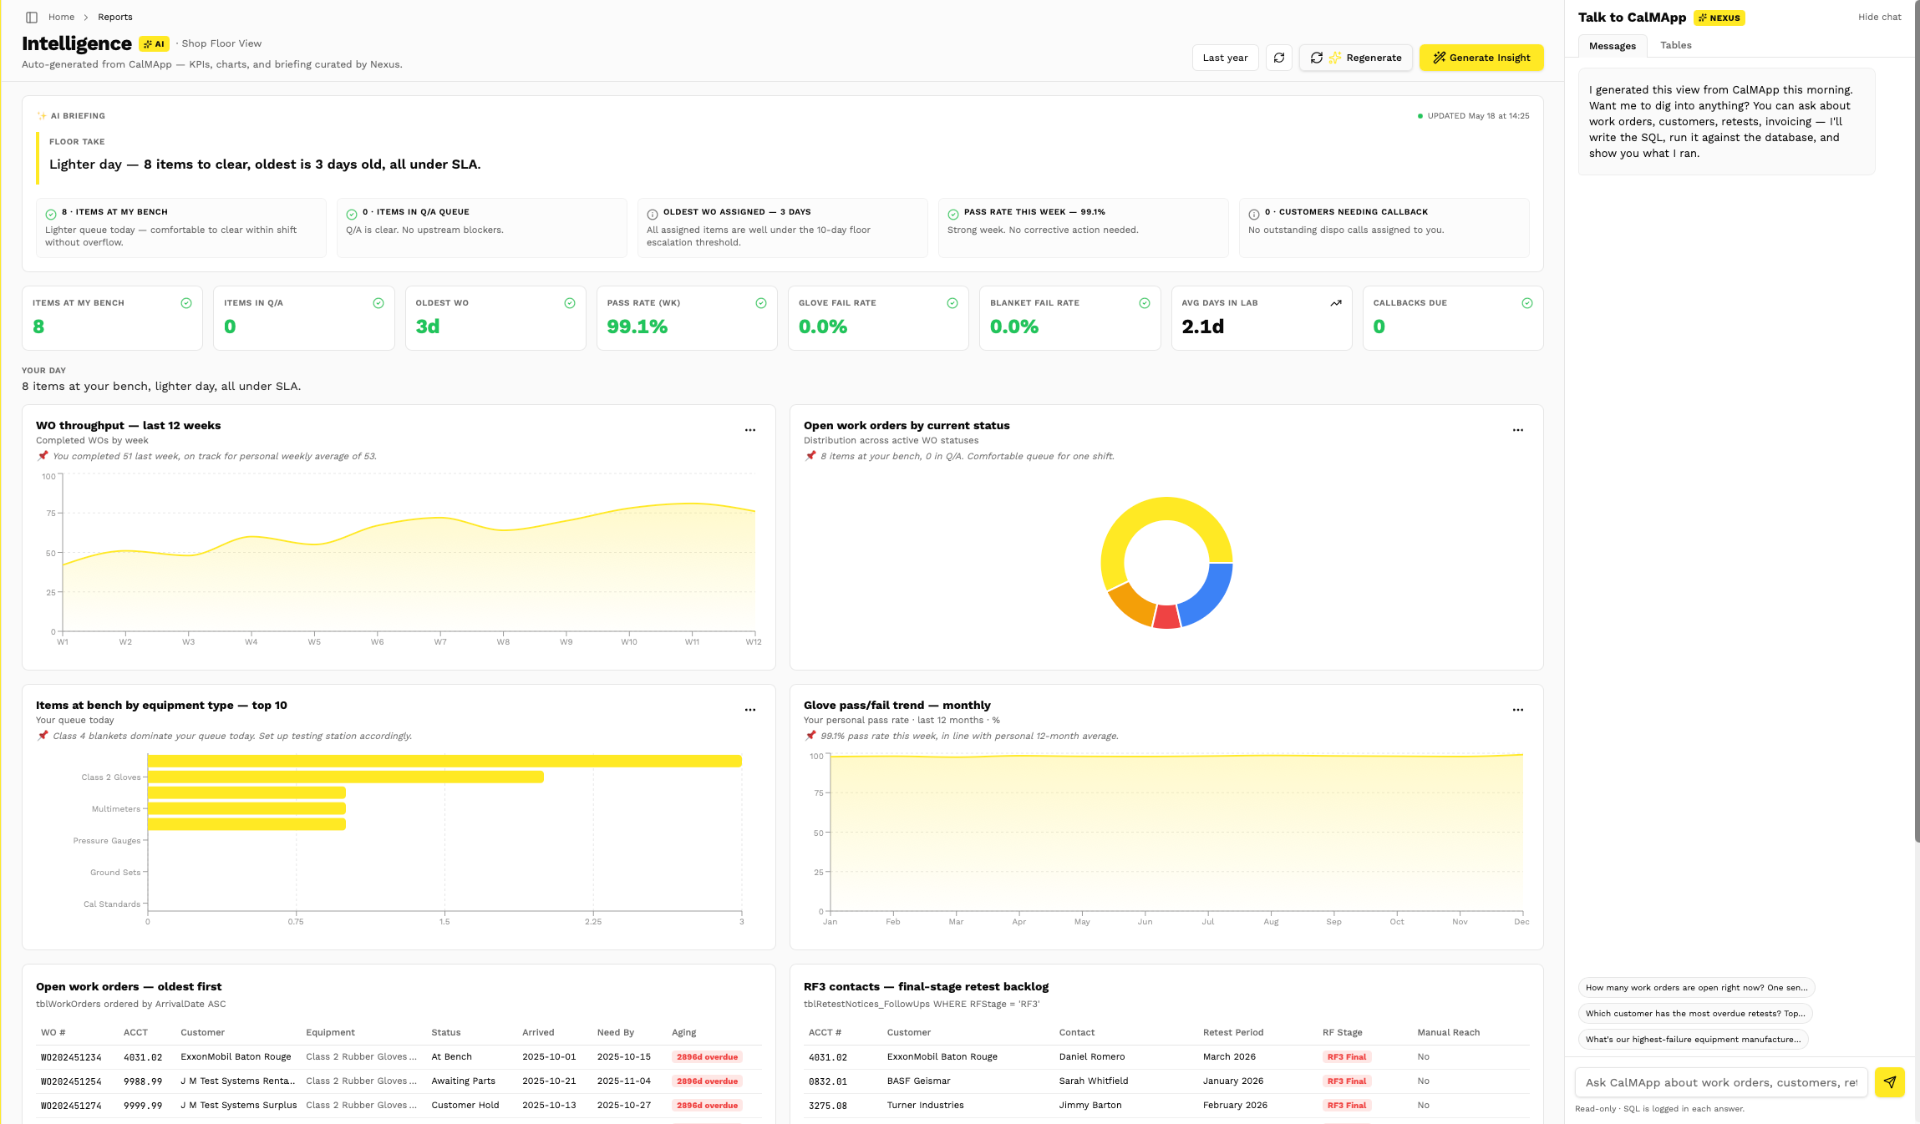
Tailored to every role at JM Test.

All three tiers, personalized. The CEO doesn't look at the same dashboard as the shop floor.

CEO

Revenue trends, customer concentration risk, strategic KPIs. Top of the org sees only what moves the needle.

CTO

Data quality, integration health, system reliability. The technical view of operations.

Manager

Queue depth, SLA risk, throughput, pass/fail by manufacturer. Bottlenecks and staffing.

Shop Floor

Personal queue, items at bench, today's worklist, urgent retests. What each technician actually needs to do this hour.

Every role gets all three tiers — replacement, derived, insights — shaped to what they actually do. The framework extends to Finance, Sales, Customer Success by prompting, not engineering.

Same database. Same AI. Two completely different dashboards.

CEO view
CEO view dashboard
Shop Floor view
Shop Floor view dashboard

Prototype shown · representative data · the live engine generates these from your CALMAPP database.

How it works.

01IntrospectRead schema, sample rows, learn the domain
02GenerateClaude composes KPIs, charts, tables — schema-grounded SQL, no hallucinations
03ValidateQuality bar: shape + sanity ranges + cardinality enforced before render
04RenderLive data, audit trail visible, every chart has its SQL one click away
  • ~50 tables sampled · 6–8 KPIs · 4–6 charts · 2–3 tables per dashboard
  • Every chart re-runs its SQL on page load — snapshot spec, live values
  • Period dropdown re-cuts the same spec via in-place SQL rewriting
Chart drawer with underlying data and SQL

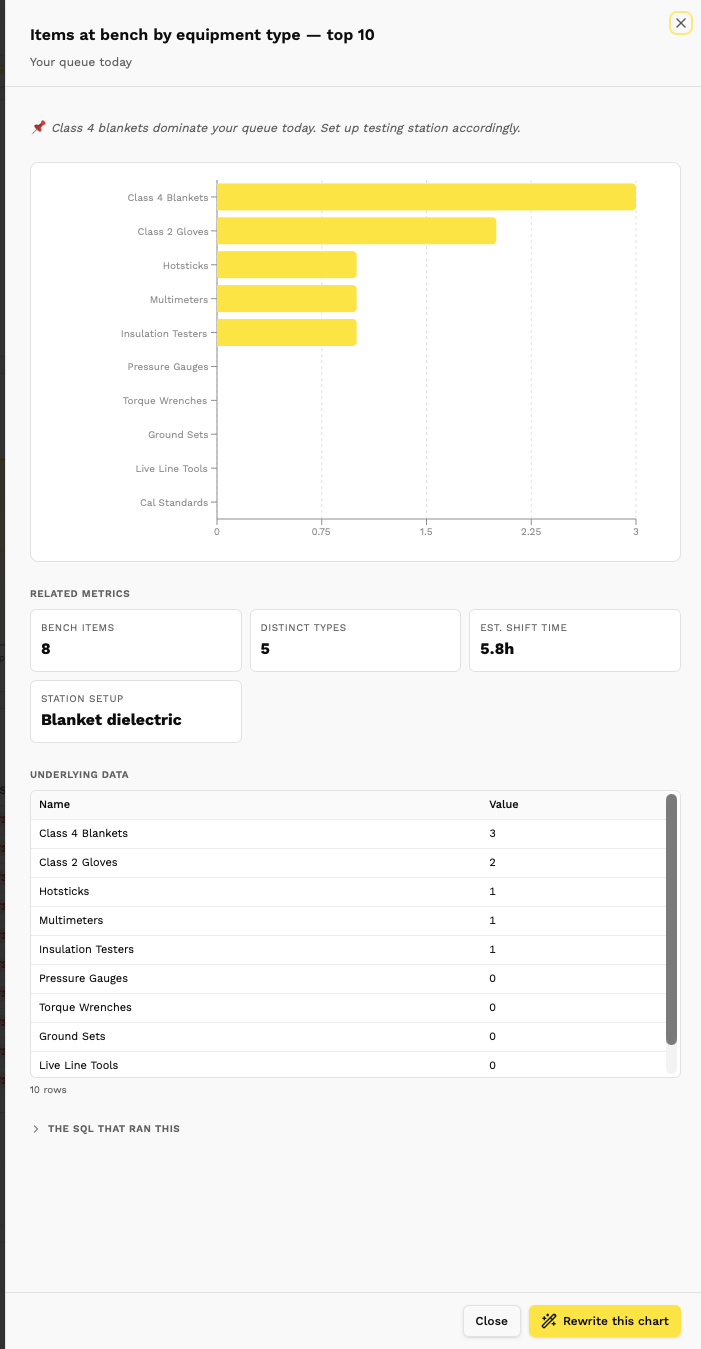
Every chart, one click from the SQL that built it. Nothing is hidden, nothing is hallucinated — paste the query into your own database and get the identical numbers.Prototype · representative data

Ask it anything.

Chat panel — plain English in, SQL out

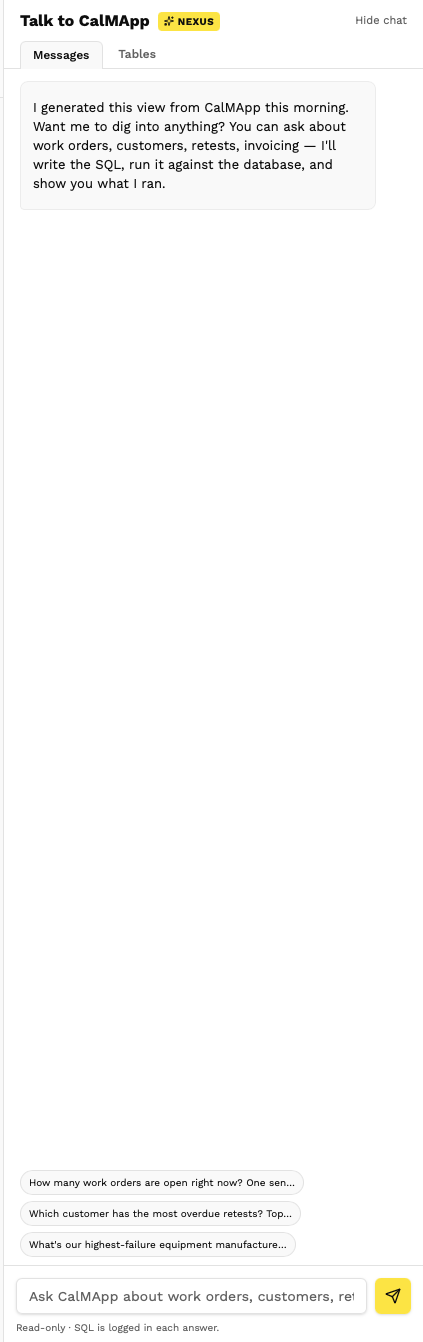
The chat panel takes plain English, writes the SQL, runs it, and shows you exactly what it ran. Ask a follow-up, drill in, refine — the conversation stays grounded in your live data.

No black box — not because the model is hidden, but because every answer carries the query that produced it.

Prototype · representative data

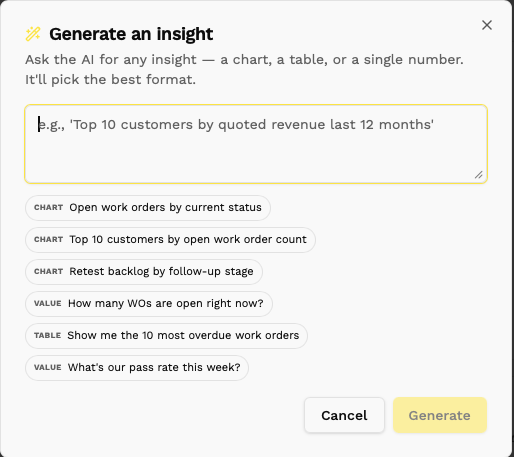
Generate any insight, on demand.

Generate Insight turns a single prompt into the right artifact for the dashboard — the AI picks the format: a chart, a table, or a single number — and drops it in, live against your data.

It's how non-technical users build their own views without filing a ticket. Every insight still carries its SQL, so engineering can audit anything the business ships.

Prototype · representative data

Generate Insight prompt modal

What this changes.

Weeks → minutes

Spin up a role-specific dashboard in a regenerate cycle.

Three tiers, one engine

Replacement, derived, insights — all generated from the same data plane.

Auditable AI

Every chart and chat answer shows its SQL. No black boxes.

Role-shaped, not one-size-fits-all

CEO, CTO, Manager, Shop Floor, each with their own intelligence. New roles spin up by prompting, not by engineering.

What's next.

Customer Portal
The same three-tier framework, dropped into JM Test's customer-facing portal. Utilities and energy customers get their own role-shaped AI co-pilot.
Deeper role coverage
Finance, Sales, and Customer Success views, plus per-technician personalization on the shop floor. Same engine, new role prompts.
Cross-customer benchmarks
Anonymized peer comparisons across JM Test's whole customer book. Strategic insight no single customer could derive on their own.

Designed for technical scrutiny.

The questions your team will ask — and the answers built into the architecture.

Does our data leave our network?

Schema structure informs the AI; the data itself is queried inside your environment. Need it fully contained — the model runs on AWS Bedrock or Google Vertex inside your own cloud.

Can the AI change our data?

No. It is read-only, enforced at two independent layers. It cannot issue a write — by design, not by luck.

How do you prevent hallucinated numbers?

The AI can only use tables and columns that actually exist in your schema. Every query is validated and executed before a single number reaches the screen.

Is role access actually enforced?

Role access is enforced at the database layer — each role connects under its own permissions. A technician's connection cannot read revenue tables, even if asked.

What does it take to connect it to CalMApp?

Connecting a database is a credentials step. The first dashboard generates in 60 to 120 seconds; refreshes after that are near-instant.

Let us show you.

A walkthrough of the prototype now.

↓ press space to begin